 LinuxAIO
LinuxAIO
LinuxAIO
A comprehensive performance data collector for Linux systems. Captures CPU, memory, storage, and system metrics for interactive analysis via web interface.
Capture CPU, memory, storage, and system metrics instantly. Duration from 10 to 900 seconds with high-resolution disk metrics option.
Background monitoring that automatically triggers data collection when resource utilization exceeds configurable thresholds (default 80%).
Schedule automated performance captures using cron. Supports hourly, daily, or custom intervals with full validation.
Web-based HTML reports with interactive Plotly visualizations. Data processed in-memory, reports auto-deleted after 10 minutes.
Run locally with Docker. Perfect for air-gapped environments or when you need full control over your data.
No PII collected. All processing happens locally or in-memory. Client-side visualization with JavaScript.
# Download
wget https://raw.githubusercontent.com/samatild/LinuxAiOPerf/main/build/linux_aio_perfcheck.sh
# Make executable
chmod +x linux_aio_perfcheck.sh
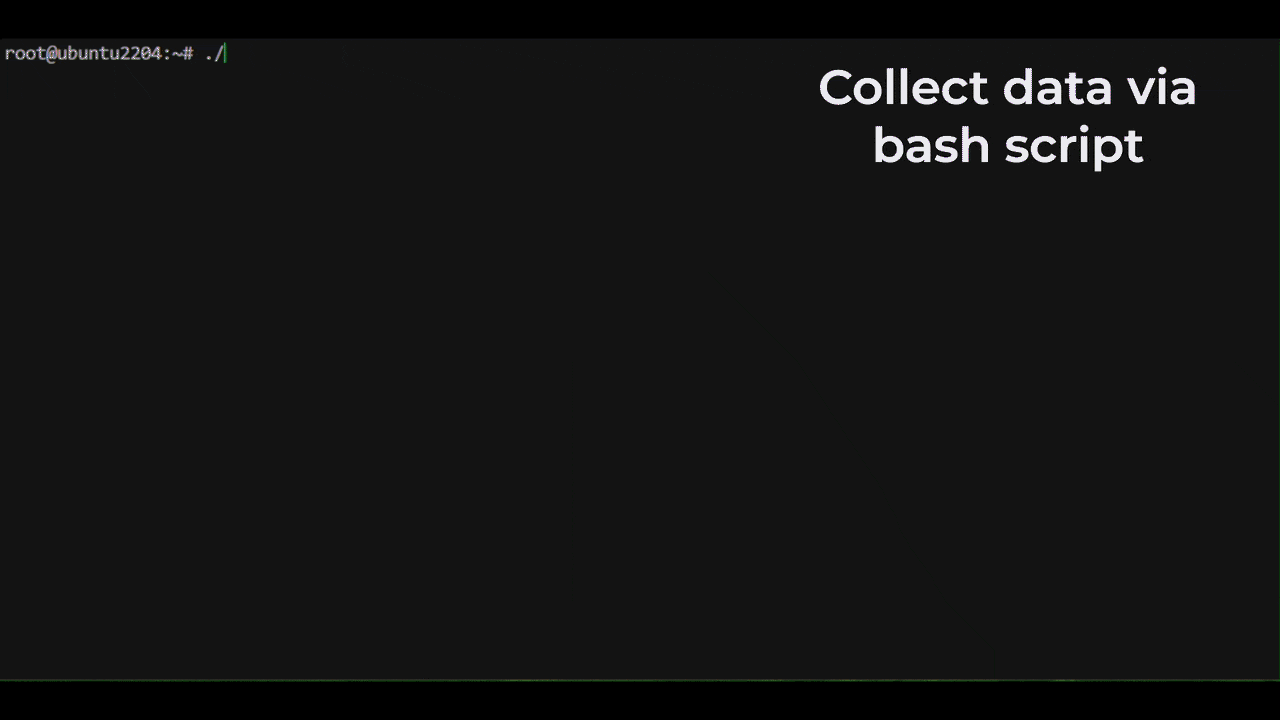
# Run (interactive mode)
sudo ./linux_aio_perfcheck.sh
# Or quick 60-second collection
sudo ./linux_aio_perfcheck.sh --quick -t 60